This past legislative session was regarded as a major improvement to the fiscal condition of the State of Illinois. Many media organizations reported that with the help of the much needed American Rescue Plan (ARP) funds, as well as enhanced economic activity from the pandemic’s end in sight, Illinois (oddly) seems to (finally) be on the right fiscal track by reducing the backlog of unpaid bills from a peak of nearly $17 billion in 2017 to now $3.5 billion.
Here at Prairie State Policy, we wanted to illustrate what that actually looks like. So, we created some charts.
However, before we dive into those a couple of notes. First, the Office of the Comptroller publishes a debt transparency report every month. The most recent report uses data at the end of April 30, 2021.
Next it is important to ascertain the difference between the Comptroller’s backlog of unpaid bills and the backlog of the General Fund. Figure 1 below illustrates this difference.

The Office of the Comptroller has a larger backlog of bills because that department is obligated with paying the state’s bills, whether it be paying off bonds, making pension payments and paying social service providers.
The other half of the General Funds Bills Backlog contains bills still on hold at state agencies that are not yet sent to the Office of the Comptroller. They can be thought of as pending invoices to the Office of the Comptroller. There are 83 total state agencies and universities. According to the most recent report, 25 agencies did not have any liabilities.
Let’s take a look at the composition of bills at the Office of the Comptroller in Figure 2 below.
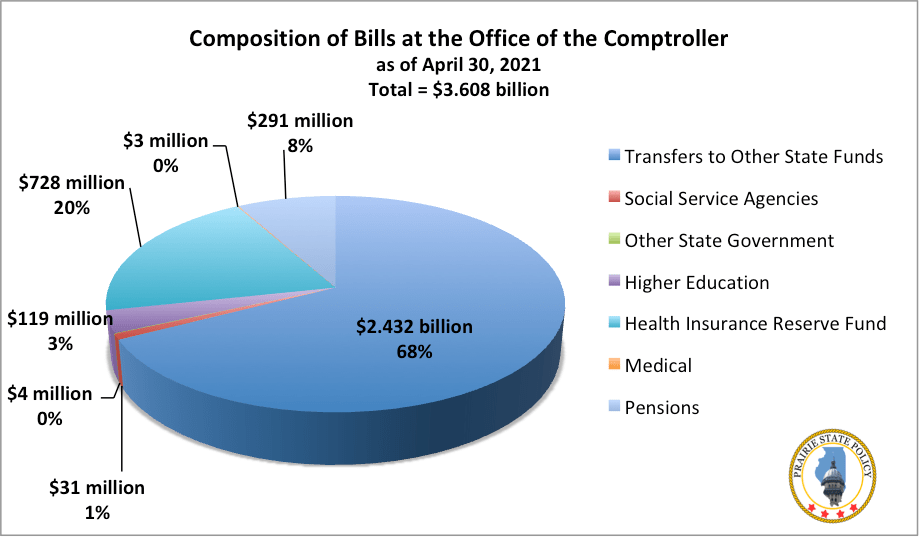
The vast majority of the backlog are transfers to other state funds with health insurance bills eating up the next highest amount. Pending pension payments should also be noted, making up 8 percent overall.
Now let’s take a look at the state’s performance at paying down the backlog the last four years. Before we analyze these charts, a couple of important notes:
- Because the numbers can fluctuate every month (a new debt transparency report is created towards the end of every month) the source of data are the debt transparency reports.
- However, the first debt transparency report was published December 31, 2017 per Public Act 100-0552 effective January 1, 2018. In effect, there is no debt transparency report for April 30, 2017.
- We will instead need to use data from the Office of the Comptroller’s Voucher Backlog Report (VBR) to get an estimate at where the General Fund Backlog and Comptroller’s Backlog stood since 2017.
- To gauge an accurate comparison of the data across all years, we will use data on where each backlog stood a the beginning of each fiscal year (July 1st), with the only exception June 11th for 2021.
Figure 3 below illustrates the estimated backlog for both the General Fund and the Office of the Comptroller.

One of the first observations is the major drop in both backlogs from 2017 to 2018. This is partially because the state issued $6 billion in general obligation bonds to pay down debt and meet their obligations.
The other reason why 2017 contained a higher backlog against other years is because of the state budget impasse between Gov. Rauner and the General Assembly. Because of the impasse, the state could not spend money that was not unauthorized, resulting in an increase in the backlog. Certain payments were authorized via court orders and consent decrees and continuing appropriations.
The budget impasse could also explain the ratio between the two backlogs. During impasse, a larger amount of payments were put on hold because they were not authorized to be spent. This resulted in a bigger ratio between the bill backlog of the General Fund and Office of the Comptroller. After the impasse ended in late 2017, the ratio between the two narrowed.
Now to address the big elephant in the room: where does it show that the state’s bill backlog was almost $17 billion as reported by the news organizations and the Office of the Comptroller?
The short answer is it does not due to our data set. The General Fund Backlog reached its peak of $16.675 billion on November 8, 2017. Because we are using data from the beginning of each fiscal year, that number would not be reflected in this study.
While it is quite an accomplishment that the state has managed to cut General Fund Backlog down by about $13 billion and Comptroller’s Backlog down to nearly $8 billion (the Comptroller’s Backlog was roughly $10 billion on November 8, 2017) in only four years, much of the success in that is due to the end of the budget impasse and issuance of general obligation bonds. From 2017 to 2018, both the General Fund and Comptroller’s Backlogs were cut by nearly half in just a year.
Despite the technicalities, the future looks bright as long as the trend of decreasing the backlog of bills continues. And although the influx of ARP funds are temporary, they have provided the state with much needed support to help meet its obligations and help the state allocate more money to essential public services and goods, such as infrastructure, education, and social services. By continuing to cut the bill backlog, the more flexibility the state will have to invest in these areas without issuing general obligation bonds or relying on the federal government.
Discover more from Prairie State Policy
Subscribe to get the latest posts sent to your email.
