A Look at the State’s GDP Performance
Overview
The state of Illinois is currently the sixth most populous state, is the economic engine of the Midwest, and has the fifth highest GDP in the Union. Moreover, Illinois’ economy is so big that is the equivalent to that of Switzerland. This blog provides a snapshot of how Illinois’ economy is performing benchmarked to other states and the types of goods and services we produce.
Understanding GDP
What is Gross Domestic Product (GDP)?
Gross Domestic Product (GDP) is a measure of the total amount of goods and services an economy produces in a given year. Economists use GDP to analyze how strongly a country’s economy is performing. A country’s GDP can be calculated from the following equation:
Y = C + I + G + (X-M)
Y = GDP or national income. It is the output of a county’s total consumption, plus investment, plus government spending, plus net exports minus net imports.
C = consumption. This refers to consumer spending, normally private spending, and is a measure of how much people spend on goods and services. The more people spend, the higher likelihood the economy will have a high GDP because people will have greater disposable income to spend on products and services than otherwise. In effect, that spending is circulated in the economy, enhances consumer confidence, and causes businesses to thrive as they sell more of their products and services due to people having a high capacity to buy.
I = investment. This refers to private investment, normally via individuals and businesses, to help finance projects or ventures in hopes that they will yield a high future return. Higher investment signals high market confidence and will result in higher spending.
G = Government spending. This is a measure how much the government is investing in public goods, such as infrastructure, education and healthcare. A solid tax base and efficient system of taxation allows the government to make these investments.
X = Net exports: This refers to the net total amount of goods a country is selling to other countries. The more a country is selling, the higher return they receive. This return is reinvested in the economy through higher spending as businesses produce more as they sell more. Typically, it is often in the interest of a country to have more exports than imports because it indicates that the economy is selling more goods than brining in. The reverse is sometimes referred to as a “trade deficit.”
M = Net imports: This refers to how much a country is buying from another country. Countries import certain goods from other countries that specialize in producing those goods. As the country imports these goods, they are sold to market to help meet the needs of its citizens.
Actual GDP vs. Real GDP
While the information above provides a roadmap to determine how a country’s economy is fairing, there are other factors not included in the standard GDP equation that may influence the performance of an economy, such as the fluctuation in prices. Economists address this issue by calculating “Real GDP” which can provide a more accurate snapshot of economic performance and is expressed in the following equation:
R = N/D
N = This stands for nominal GDP, which is basically Y from the equation above. Most importantly, it is GDP that assumes current price levels, without any adjustment to inflation.
D = GDP deflation. This measure the change in prices in the economy. The term “inflation” is used to describe an increase in prices and “deflation” refers to a decrease in prices.
Illinois’ GDP Performance
Gross Domestic Product can be narrowed to evaluate how a state’s economy is fairing benchmarked against others. According to U.S. Bureau of Economic Analysis, Illinois’ real GDP is approximately $773 billion, making it the fifth largest economy in the Union, trailing only Florida, New York, Texas, and California in that order.
Illinois’ real GDP has consistently grown over the years as state continued to produce more goods and services per year, adjusted for inflation. The figure below provides a snapshot on how Illinois’ economy has faired since 1997.

There are a few trends to note from the illustration above. First, Illinois’ economy experienced two dips: a slight slump in 2001 and a major one beginning in 2007. This was the result from national economic circumstances as the United States’ economy experienced a recession in the early 2000s, partly caused by the collapse of the dot-com bubble, a downturn in the manufacturing industry, and depletion of consumer confidence from the 9/11 terrorist attacks, and then the historic Great Recession of 2007-2008.
Second, Illinois’ economy began to rebound more quickly from the 2001 recession than the Great Recession. The recovery from the 2001 recession began in late 2001-early 2002 while it took nearly two years for the recovery to get under way from the Great Recession.
Total Real GDP Per Capita
Real GDP can be narrowed even further to analyze the average output each person is contributing to the overall economy, adjusted for inflation. This is referred to as total real GDP per capita. As of 2019, Illinois’ GDP per capita stood at roughly $61,012.18. The figure below illustrates the average economic output per person each year since 1997. The same economic trends for Figure 2 are consistent with Figure 1 above, with real GDP per capita decreasing in 2001 and 2007.

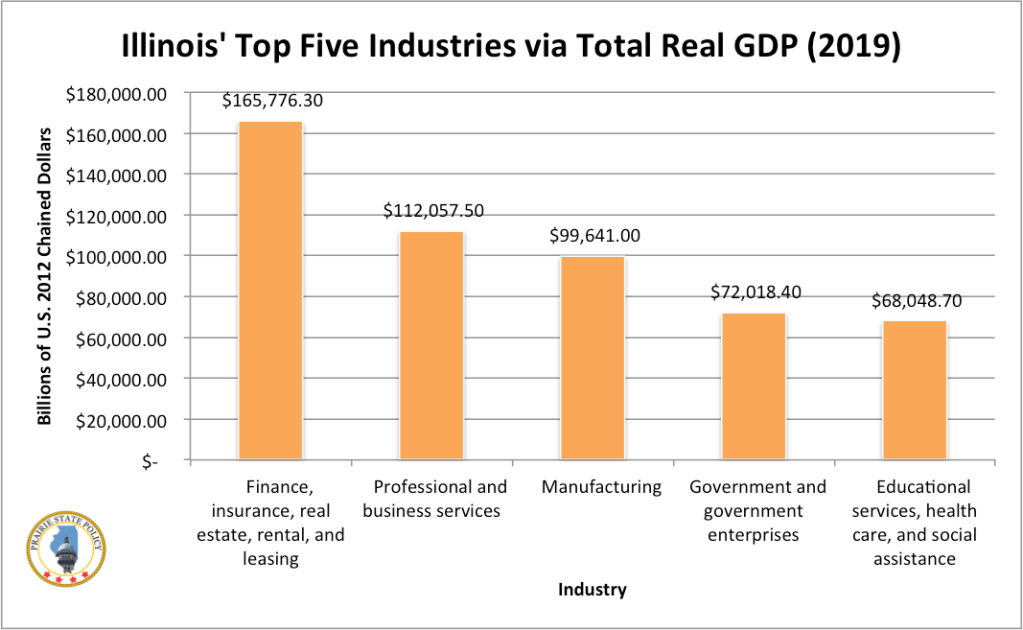
Total Real GDP Breakdown by Industry
The largest industry of Illinois’ economy is the financial sector, which includes finance, insurance, real estate, rental, and leasing. This industry produced about $165 billion of economic output in 2019, nearly $53 billion more than Illinois’ second largest industry, professional services.
How Illinois’ Total GDP Fairs Compared to Other States
As previously noted, Illinois has the fifth largest economy in the Union as a measure of total real GDP. Moreover, Illinois is only one of twelve states in the Union which has a GDP over half a trillion dollars. Currently, there are only three states which have a trillion dollar economy: New York with about $1.5 trillion; Texas with about $1.7 trillion, and California with $2.8 trillion. Figure 4 below illustrates the top ten states with the biggest economies in the Union.

It should also be noted that there is a correlation between states with high populations and high GDPs. For example, the top five states with the highest GDP also have the highest populations in the same order with the exception of one state: Illinois. In 2017, Pennsylvania passed Illinois to be the fifth most populous state. Despite this, Illinois’ GDP has continued to surpass Pennsylvania, albeit by not that much. Moreover, as Illinois’ population continues to decline it may be likely that Pennsylvania will eventually become the fifth largest economy in the Union.
Discover more from Prairie State Policy
Subscribe to get the latest posts sent to your email.
